Google Analytics
 If you don't know what Google Analytics is, haven't installed it on your website, or have installed it but never look at your data, then this page is for you. While it's hard for many to believe, there are still websites that are not using Google Analytics (or any analytics, for that matter) to measure their traffic. On this page, we're going to look at Google Analytics from the clients point of view. Why you need it, and how to use it, and workarounds to common problems.
Why every website owner needs Google Analytics
Do you have a website? If the answer is yes, whether they are for personal or business use, then you need Google Analytics. Here are just a few of the many questions about your website that you can answer using Google Analytics.
- How many people visit my website?
- Where do my visitors live?
- Do I need a mobile-friendly website?
- What websites send traffic to my website?
- What marketing tactics drive the most traffic to my website?
- Which pages on my website are the most popular?
- How many visitors have I converted into leads or customers?
- Where did my converting visitors come from and go on my website?
- What news/blog content do my visitors like the most?
There are many, many additional questions that Google Analytics can answer, but these are the ones that are most important for most website owners. Now let's look at how you can get Google Analytics on your website.
How to install Google Analytics
First, you need a Google Analytics account. If you have a primary Google account that you use for other services like Gmail, Google Drive, Google Calendar, Google+, or YouTube, then you can set up your Google Analytics using that Google account. Or you can contact you web developer to create a new one for you.
Set up your account and property
Once your Google account is set up, you can go to Google Analytics and click the Sign into Google Analytics button. You will then be greeted with the three steps you must take to set up Google Analytics.
Then you will continue through all of the above-mentioned steps.
Once Google Analytics is installed on your website(s), set up your goals, and set up site search(es), you should wait about 24 hours for it to start getting data. Then you will be able to start viewing your data.

How to view Google Analytics data
Once you start getting in Google Analytics data, you can start learning about your website traffic. Each time you log in to Google Analytics, you will be taken to your Audience Overview report. Alternatively, if you have more than one website, you will be taken to your list of websites to choose from, and then taken to the Audience Overview report for that website. This is the first of over 50 reports that are available to you in Google Analytics. You can also access these reports by clicking on the Reporting link at the top.

Standard report features
Most of the standard reports within Google Analytics will look similar to this. At the top right, you can click on the drop-down arrow next to your website to switch to different websites within all of your Google Analytics accounts. Or you can click the Home link at the top.

In the report at the top right, you can click on the dates to change the date range of the data you are viewing. You can also check the Compare box to compare your data from one date range (such as this month) to a previous date range (such as last month) to view your data.

You can hover over a variety of areas on your Google Analytics reports to get more information. For example, in the Audience Overview, hovering over the line on the graph will give you the number of sessions for a particular day. Hovering over the metrics beneath the graph will tell you what each one means.

Beneath the main metrics, you will see reports that you can switch through to see the top ten languages, countries, cities, browsers, operating systems, services providers, and screen resolutions of your visitors.

You can click the full report link on each to see the full reports. Or you can click on any of the top ten links to see more details. For example, clicking on the United States in Countries will take you to the full Location report, focused in on visitors from states within the US.

In this view, you can hover over each state to see the number of visitors from that state. You can scroll down to the table and hover over each column name to learn more about each metric.

You can also click on the name of each state to see visitors from cities within the state. Effectively, any time you see a clickable link or a ? next to something, you can click on it or hover over it to learn more. The deeper you dive into your analytics, the more interesting information you will find.
Types of Google Analytics reports
Speaking of reports, here is quick summary of what you will find in each of the standard Google Analytics reporting sections, accessible in the left sidebar.
Everything in (parenthesis) is a specific report or set of reports within the following sections that you can refer to.
Audience reports
These reports tell you everything you want to know about your visitors. In them, you will find detailed reports for your visitors' age and gender (Demographics), what their general interests are (Interests), where they come from (Geo > Location) and what language they speak (Geo > Language), how often they visit your website (Behavior), and the technology they use to view your website (Technology and Mobile).
Acquisition reports
These reports will tell you everything you want to know about what drove visitors to your website (All Traffic). You will see your traffic broken down by main categories (All Traffic > Channels) and specific sources (All Traffic > Source/Medium).
You can learn everything about traffic from social networks (Social). You can also connect Google Analytics to AdWords to learn more about PPC campaigns and to Google Webmaster Tools / Search Console to learn more about search traffic (Search Engine Optimization)
Behavior reports
These reports will tell you everything you want to know about your content. Particularly, the top pages on your website (Site Content > All Pages), the top entry pages on your website (Site Content > Landing Pages), and the top exit pages on your website (Site Content > Exit Pages).
If you set up Site Search, you will be able to see what terms are searched for (Site Search > Search Terms) and the pages they are searched upon (Site Search > Pages).
You can also learn how fast your website loads (Site Speed) as well as find specific suggestions from Google on how to make your website faster (Site Speed > Speed Suggestions).
Conversions
If you set up Goals within your Google Analytics, you can see how many conversions your website has received (Goals > Overview) and what URLs they happened upon (Goals > Goal URLs). You can also see the path that visitors took to complete the conversion (Goals > Reverse Goal Path).
Speaking of goals and conversions, most of the tables within Google Analytics standard reports will tie specific data to your conversions. For example, you can see the number of conversions made by visitors from California in the Audience > Geo > Location report. You can see the number of conversions made by visitors from Facebook in the Acquisitions > All Traffic > Source/Medium report. You can see the number of conversions made by visitors who landed on specific pages in the Behavior > Site Content > Landing Pages report.

If you have multiple goals, you can use the dropdown at the top of that section of data to switch to the goal you want to view or all of your goals if you prefer.
Shortcuts and emails
While you won't need every report within Google Analytics, you should explore them all to see what they have to offer. When you find some that you want to visit again and again, use the Shortcut link at the top of the report to add them to the Shortcuts in your left sidebar for faster access.

Or, use the email button to have them emailed to you (or others on your team) on a regular basis.

If you choose to send emails to someone outside of your organization, be sure to regularly check your emails by going to your Admin menu and clicking on the Scheduled Emails box under the View column to ensure only people working with your company are getting your data.


From there, you can add the email address of anyone you would like to view your Google Analytics data and choose the permissions you would like them to have.


By: Kristi Hines

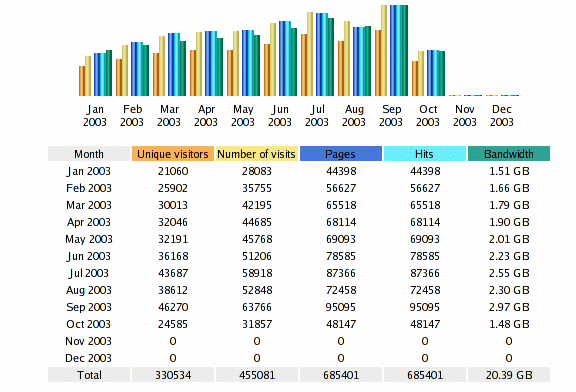
AWStats is a free powerful and featureful tool that generates advanced web, streaming, ftp or mail server statistics, graphically.
This log analyzer works as a CGI or from command line and shows you all possible information your log contains, infew graphical web pages. It uses a partial information file to be able to process large log files, often and quickly. It can analyze log files from all major server tools like Apache log files (NCSA combined/XLF/ELF log format or common/CLF log format), WebStar, IIS (W3C log format) and a lot of other web, proxy, wap, streaming servers, mail servers and some ftp servers.
Take a look at this comparison table for an idea on features and differences between most famous statistics tools (AWStats, Analog, Webalizer,...).
AWStats is a free software distributed under the GNU General Public License. You can have a look at this license chart to know what you can/can't do.
As AWStats works from the command line but also as a CGI, it can work with all web hosting providers which allow Perl, CGI and log access